Total U.S. employment1 grew from an average of 122.1 million persons in the first quarter of 1994 to 124.4 million in the fourth quarter, a gain of 2.3 million. The employment-population ratio - the percent of the civilian noninstitutional population 16 years old and over who are employed - increased from 62.3 to 62.9 percent over the period.
Adult men (20 years old and over) accounted for a little over half of the increase in total employment or about 1.3 million; 64.1 million were employed in the fourth quarter. The number of employed adult women (54.1 million on average in the fourth quarter) rose by almost 900,000 over the period. Teenage (persons 16 to 19 years old) employment also grew during 1994, from 6.1 to 6.2 million, with much of the improvement occurring in the fourth quarter.
Employment increased among Whites throughout 1994, as their employment-population ratio rose by 0.7 percentage point to 64.0 percent. The number of employed Blacks and Hispanics2 grew at an even faster pace, their employment-population ratios rising by 1.3 and 1.7 percentage points respectively, to 56.8 percent for Blacks and 60.7 percent for Hispanics.
Increases in employment were accompanied by widespread unemployment declines in 1994.
The decline in unemployment that began in mid-1992 continued during 1994. By the fourth quarter of 1994, the number of unemployed3 persons stood at 7.3 million, and the unemployment rate4 was 5.6 percent, down from 8.6 million and 6.6 percent respectively, in the first quarter of 1994. Unemployment rate declines occurred not only among adult workers but among teenagers as well.
Similarly, unemployment declined for both Blacks and Whites. The unemployment rate for Blacks fell from 12.7 percent in the first quarter of 1994 to 10.4 percent in the fourth quarter. Over the same period, the rate for Whites declined 0.8 percentage point to 4.9 percent. The unemployment rate for Hispanics, which had changed little for most of the year, fell in the fourth quarter to 9.1 percent. It is noteworthy that since 1990, the jobless rate for Hispanics has been closer to the rate for Blacks than to the rate for Whites. During the 1980's, the rate for Hispanics had held roughly midway between those for Whites and Blacks.
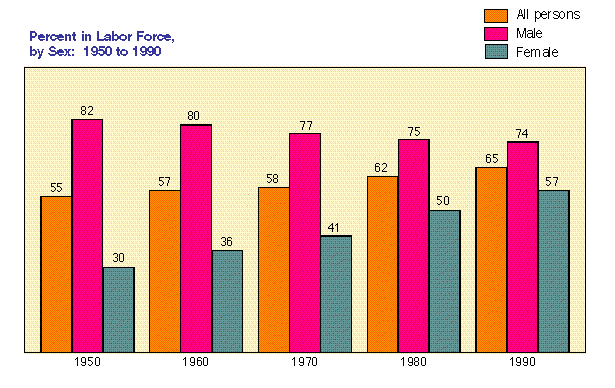
Labor force participation rates for men and women were stable in 1994; since 1950, their rates have moved in opposite directions.
The civilian labor force - the combination of employed and unemployed persons - grew by 985,000 from the first to the fourth quarter of 1994, from 130.7 to 131.7 million. This was considerably less than the increase during the same period in the prior year. The overall labor force participation rate5 rose to almost 67 percent by the end of 1994.
For adult women, the early 1990's was a period characterized by sluggish labor force growth; 1994 was no exception, as their labor force participation rate (59 percent) was unchanged over the year. For adult men, the labor force participation rate (77 percent) also was unchanged, interrupting (at least temporarily) this measure's slow, downward trend that extends all the way back to the late 1940's.
Data from the 1990 census showed that the labor force participation rates for women have risen dramatically since 1950.6 In 1950, about 30 out of every 100 working-age women participated in the labor force. This figure nearly doubled to 57 in 1990. This increased labor force participation among women more than offset the long-term decline in the labor force participation rates of men, as measured in the census, from 82 percent in 1950 to 74 percent in 1990.
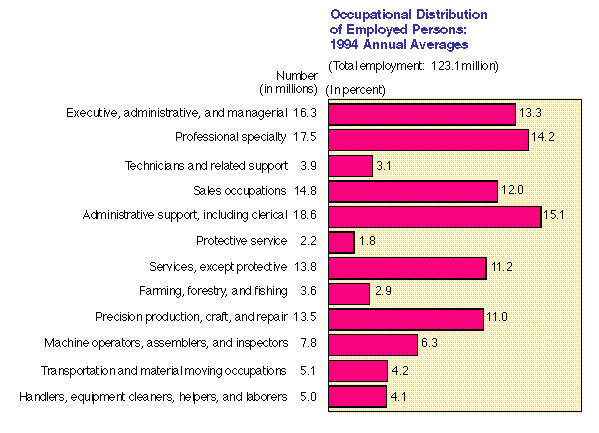
A large share of employment growth occurred among managerial and professional specialty occupations.
A little more than half of 1994's gain in total employment occurred among managerial and professional specialty workers, who, as a group, have relatively high earnings. The number of these workers rose by nearly 1.3 million between the first and fourth quarters of the year. Also showing substantial growth in 1994 were the technical, sales, and administrative support occupations, which gained about 627,000 workers over the course of the year. The occupational category of operators, fabricators, and laborers also grew, adding 445,000 workers. There had been little change in the number of such workers during the previous 3-year period. Employment among service and precision production workers and among those in farming, forestry, and fishing occupations was little changed in 1994.
---------------
1 Unless otherwise specified, estimates in this section are seasonally adjusted quarterly averages for 1994 from the Current Population Survey (CPS). CPS figures refer to civilian noninstitutional persons 16 years old and over. A major redesign of the survey was implemented in January 1994, the same month during which 1990 census-based population controls, adjusted for the estimated undercount, also were incorporated. Because of these changes, 1994 data are not directly comparable with data for 1993 and earlier years. As a result, the analysis of 1994 labor force developments is based on changes from the first through the fourth quarters of 1994.
2 Persons of Hispanic origin may be of any race. These data do not include the population of Puerto Rico.
3 Persons without a job, available for work, and actively seeking work. Also includes persons on layoff who are not necessarily looking for work.
4 The number unemployed as a percent of the civilian labor force (which is the sum of employed plus unemployed persons).
5 The number in the civilian labor force as a percent of all civilian noninstitutionalized persons 16 years old and over.
6 Census figures refer to all persons 16 years old and over, including members of the Armed Forces residing in the United States.


For Further Information
See: Employment and Earnings, U.S. Department of Labor, Bureau of Labor Statistics, Vol. 42, No.1, January 1995, and Monthly Labor Review, U.S. Department of Labor, Bureau of Labor Statistics, Vol. 118, No. 2, February 1995 (Note: Most of the statements in this section of the Population Profile are extracted from the article "Strong Employment Gains Continue in 1994" by Lois M. Plunkert and Howard V. Hayghe in this issue of the Monthly Labor Review.)
 Back to Population Profile Table of Contents

 to the Portland NORML April 18, 1996 news release item, "Illegal Drug Users - Helping Make America Strong."